Telemetry graph
Displaying graph data
Users can view the readings data on a graph. The X-axis displays the time values and the Y-axis displays the last 10 values for the reading category selected from the reading category dropdown menu.
Use the react package date-time picker to select a date and time to get readings for. The last 10 readings up to that time load and map on the graph's X and Y axes.
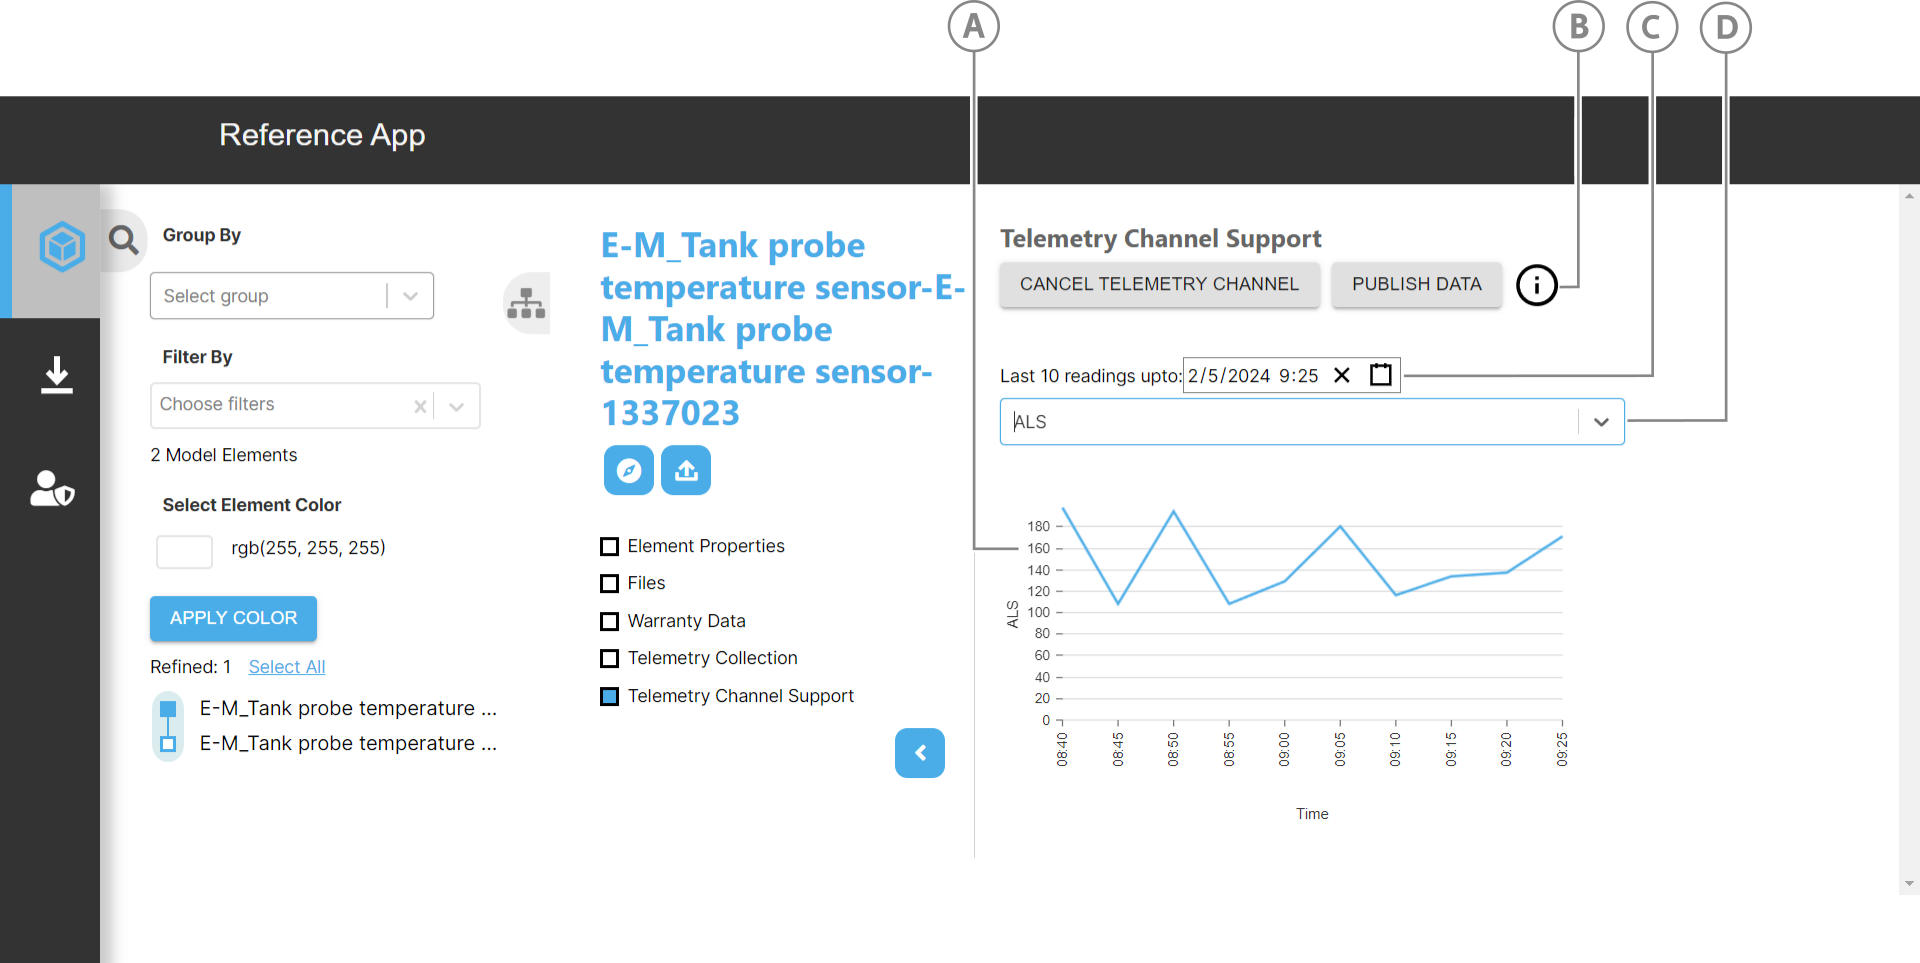
| Callout | Element | Description |
|---|---|---|
| A | Graph | Mapped readings on graph |
| B | Info icon | Click to view relative information |
| C | Date-time picker | Pick a date and time to generate the last 10 readings up to that point in time. |
| D | Reading value dropdown | Select a reading type to map. |
Getting and displaying readings on a graph
To display the readings data on a graph, TelemetryChannel.jsx imports and uses the ResponsiveLine library from nivo/line package.
The following code gets all the named user items and filters them for the "ref_app_iot_collection" telemetry collection:
let namedItemsAll = await IafItemSvc.getNamedUserItems();

let telCollections = namedItemsAll._list.find(
  (item) => item._userType === "ref_app_iot_collection"
);
IafItemSvc.getRelatedReadingItems gets the "ref_app_iot_collection" telemetry collection's related readings:
let getRelatedReading = await IafItemSvc.getRelatedReadingItems(
  telCollections._id,
  undefined,
  ctx,
  undefined
);
setGraphdata maps the readings and their data:
const setGraphdata = () => {
  // Define data for the line chart
  const data = [
    {
      id: "data",
      data: relatedReading?._list?.slice(-10).map((x, index) => {
        const date = new Date(x._ts);
        const hours = date.getHours().toString().padStart(2, "0");
        const minutes = date.getMinutes().toString().padStart(2, "0");
        const formattedDate = date.toLocaleString();

        return {
          x: `${hours}:${minutes}`,
          y: getYAxisData()[index],
          [selectedYAxis.value]: getYAxisData()[index],
          z: formattedDate,
        };
      }),
    },
  ];
  console.log("data", data)
  setGraphData(data);
};
The X-axis contains the hour and minute values and getYAxisData gets and maps the data to the graph's Y-axis:
const getYAxisData = () => {
  const mapYAxisToValues = (yAxis) => {
    return (
      relatedReading?._list?.slice(-10).map((entry) => entry[yAxis]) || [
        0, 0, 0,
      ]
    );
  };

  switch (selectedYAxis.value) {
    case "co2":
      return mapYAxisToValues("CO2");
    case "temperature":
      return mapYAxisToValues("Temperature");
    case "humidity":
      return mapYAxisToValues("Humidity");
    case "als":
      return mapYAxisToValues("ALS");
    case "pm1.0":
      return mapYAxisToValues("PM1.0");
    case "pm2.5":
      return mapYAxisToValues("PM2.5");
    case "pm10":
      return mapYAxisToValues("PM10");
    case "voc":
      return mapYAxisToValues("VOC");
    default:
      return [];
  }
};